FOOTAGE.
IN FOCUS.
Make recorded footage useful to the people running the store.
Engineered analytics. Product interface shown with sample data.Explore the case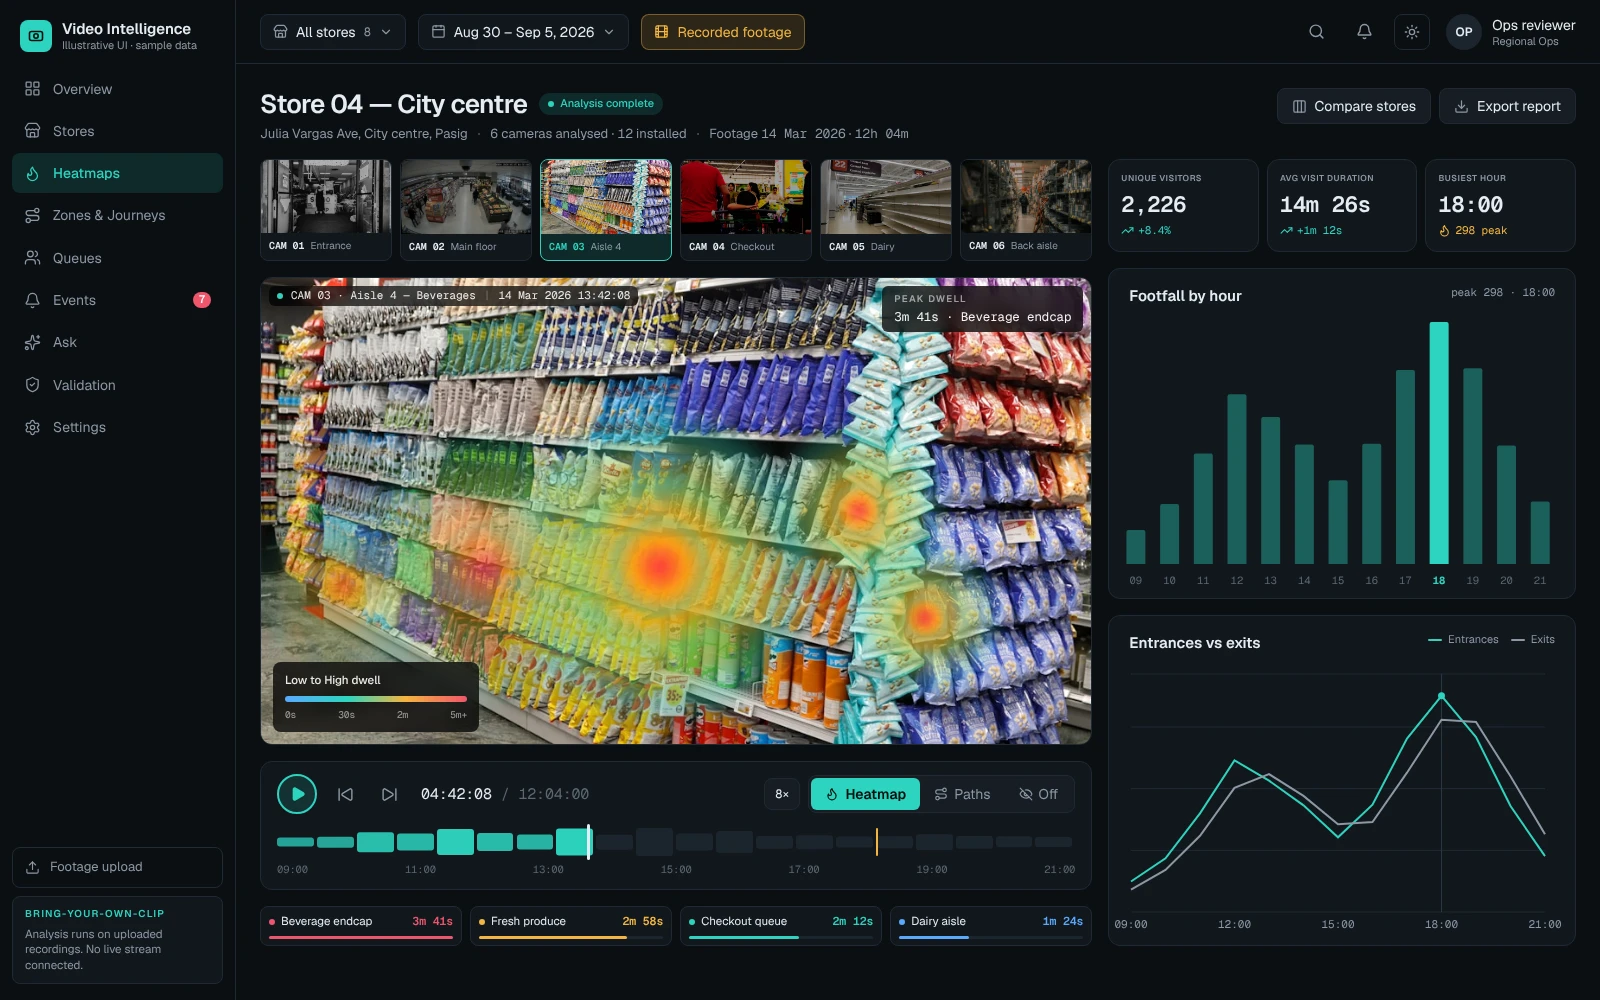
Read the store through movement.
Locate busy areas, compare dwell, and return to the recorded scene.Retail & store operations
Video intelligence platform
Product design & engineering
Recorded footage. Human review.
01Locate patterns in how people use a store.
02Connect checkout friction to a specific place and time.
03Keep flagged events open to human review.
BRING STORE
EVIDENCE INTO
THE DECISION.
Store leaders need to decide where to put attention: a checkout lane, a crowded area, or a moment that warrants investigation. Finding that evidence by replaying recordings places the search burden on the person making the decision.
We engineered a recorded-video analytics service and designed its operating interface. Person tracks support counts, movement analysis, queue measurements, and candidate events. The screens show how store teams can explore those outputs, using the interface’s demonstration dataset.
Retail teams should begin with the decision they want to improve, then choose the camera coverage and measurements that can support it.
THREE VIEWS OF
STORE OPERATIONS.
WHERE DOES
ATTENTION GO?
Footfall tells one part of the story. Dwell and movement add the location and duration. Store teams can examine how activity varies across a recorded period and which zones deserve a closer look.
THE DECISIONWhere should the store team investigate layout, placement, or congestion?
WHERE DOES
SERVICE SLOW?
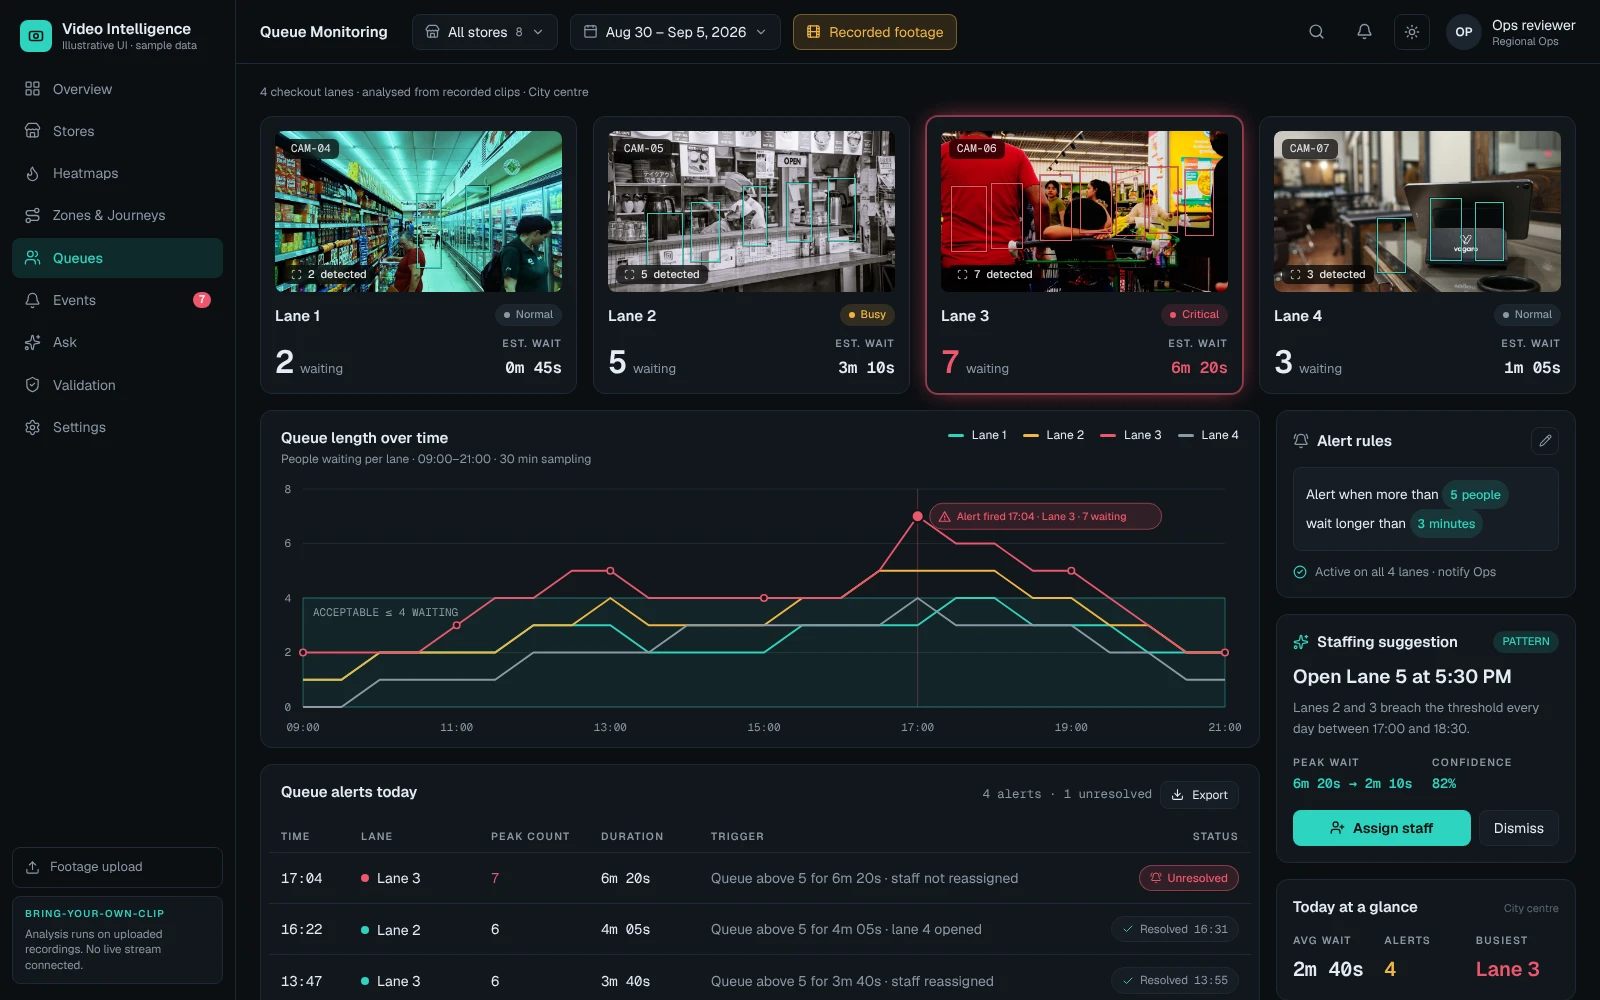
Queue measurements make checkout friction specific. Lane activity, estimated wait, and threshold alerts help managers examine when demand exceeded the service available.
THE DECISIONWhich periods and lanes should inform the next staffing review?
WHAT NEEDS
A HUMAN LOOK?
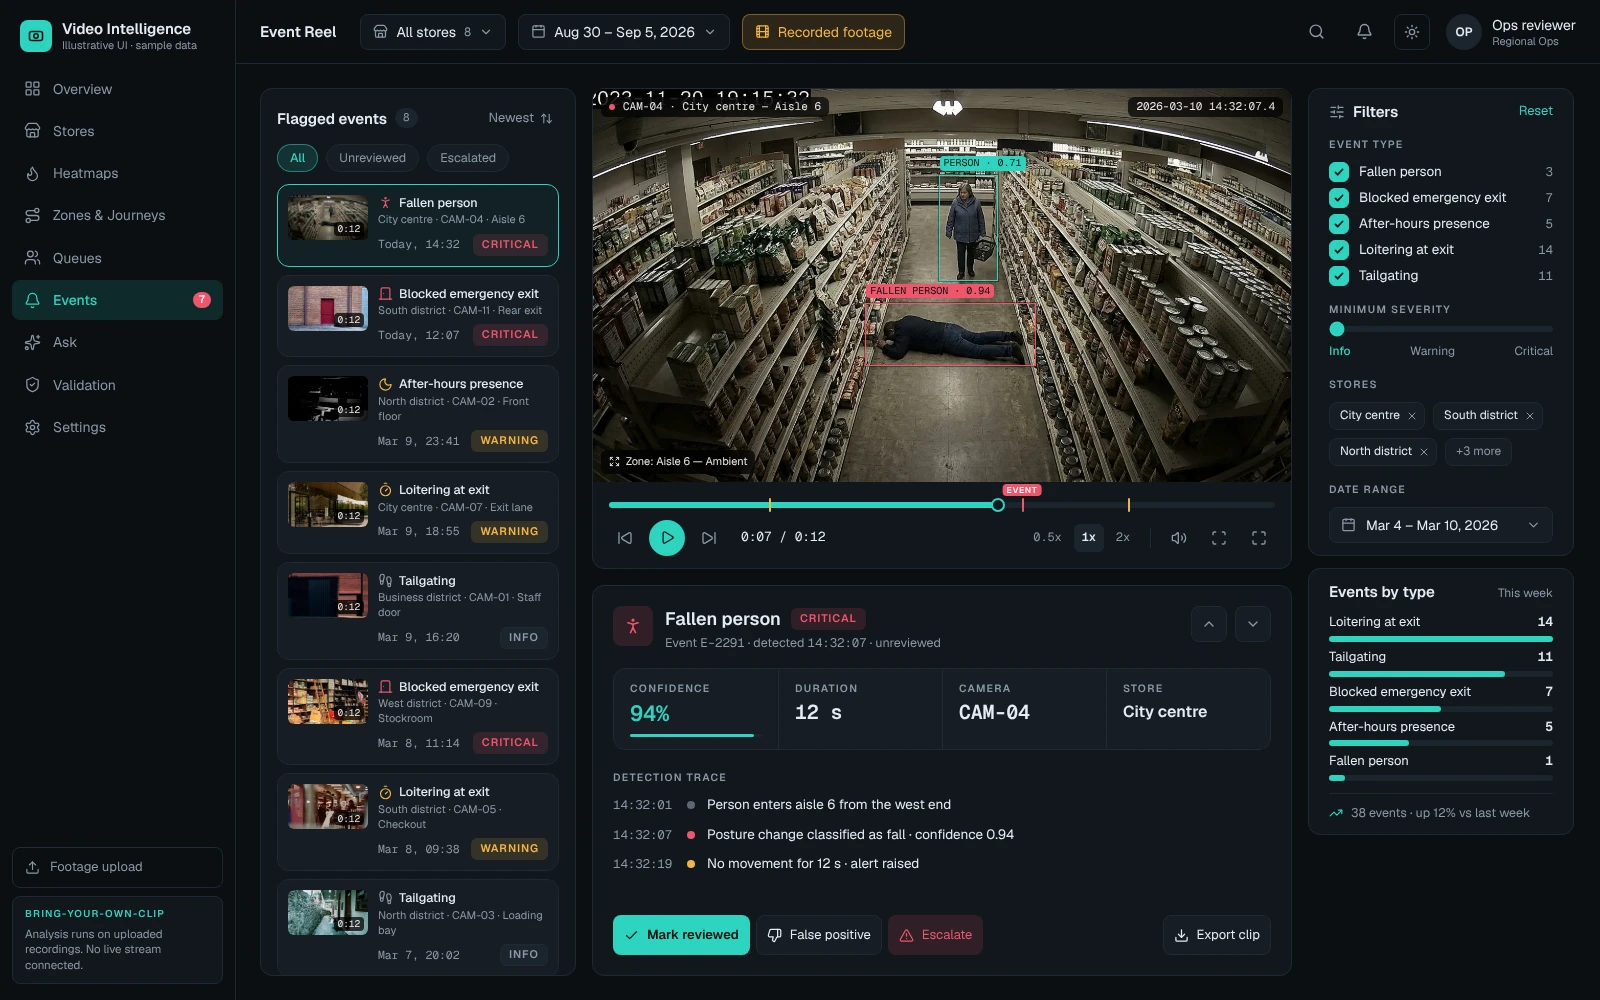
A flagged event starts a review. The event reel brings the scene, its timing, and the detection context together so an operator can assess the evidence and record a disposition.
THE DECISIONDoes the observed event require investigation or a change in store practice?
A SHARED PIPELINE
CONNECTS
THE ANALYSIS.
We designed a shared processing pipeline so each analysis starts from the same tracked activity. Counts, heatmaps, zone visits, queues, and safety events become different views of that record.
Privacy controls sit within the processing workflow. Saved evidence frames pass through face-region blurring. Tracks-only retention removes the source recording after processing and retains anonymised tracks and blurred stills. Playback and clip export require the source recording to be retained.
- 01
CAPTURE
Upload recorded footage and map the camera to the store.
- 02
TRACK
Detect people and follow movement within the recording.
- 03
INTERPRET
Calculate counts, visits, waits, and candidate events.
- 04
REVIEW
Inspect the evidence and decide what happens next.
VALIDATE AGAINST
THE STORE’S
ACTUAL CONDITIONS.
Camera angle, occlusion, lighting, and the definition of a queue affect what the system can measure. Leaders should validate representative footage against manual counts and reviewed events before using its outputs to change operating practice.
The analytics service processes uploaded recordings. The screens shown here use illustrative sample data to demonstrate the experience; their figures represent neither customer performance nor measured commercial uplift.
- Counting accuracy for the camera positions in scope.
- Queue and event thresholds that operators find useful.
- Who reviews exceptions and owns the resulting action.